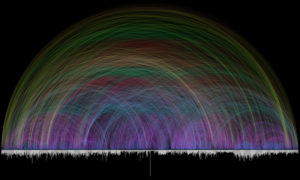
Chris Harrison created this image with Christoph Römhild. He states, “Christoph, a Lutheran Pastor, first emailed me in October of 2007. He described a data set he was putting together that defined textual cross references found in the Bible. He had already done considerable work visualizing the data before contacting me.”
This graph shows you how one part of the Bible is linked to another place in the Bible to find the same or similar topics and information. Cross references show how the Bible speaks for itself

So what is this really showing?
Each of the 63,779 cross references found in the Bible is depicted by a single arc – the color corresponds to the distance between the two chapters, creating a rainbow-like effect.
The bar graph that runs along the bottom represents all of the chapters in the Bible. Books alternate in color between white and light gray. The length of each bar denotes the number of verses in the chapter.
Harrison usually leads a research team for computer human interaction and learning. Who said data can’t be beautiful?
To explore more of what the Bible says you can sign up for one of our simple online small groups!
Check Out Bible Kick Start
- You Can See “Unsung Hero” on Opening Night for FREE, Here’s How to Get Tickets ⬇️ - April 19, 2024
- Hey for KING + COUNTRY Fans, Welcome to Hope Nation! - April 17, 2024
- Your Soundtrack for the 2024 Eclipse - April 4, 2024

Now available as an art print:
https://chrisharrison.net/index.php/Visualizations/BibleViz